Maps & Figures
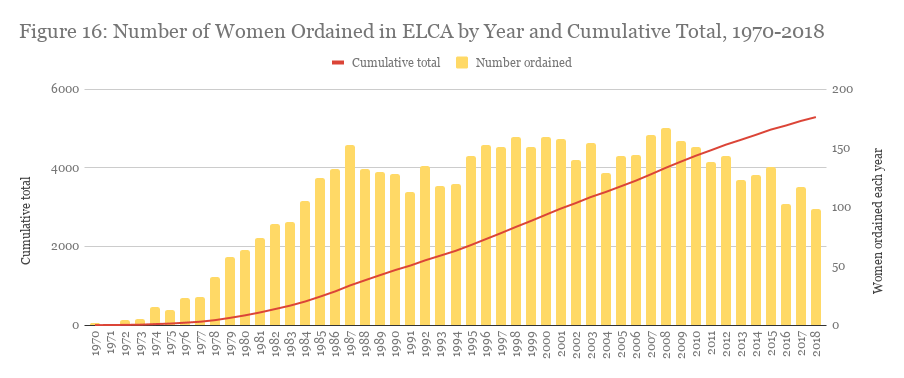
Number of Women Ordained, 1970 - July 2019
Number of Women Elected as Synodical Bishops, 1970-July 2019
%
Women as % of ELCA Clergy serving Congregations, 2016
History is often told in narratives, but sometimes figures and maps tell the story more effectively. The visual image can give insight that the verbal is slow to provide. Four groups of visualizations offer opportunity for comparisons over time, by gender and race, with other American Protestant groups, and with Lutheran churches worldwide.
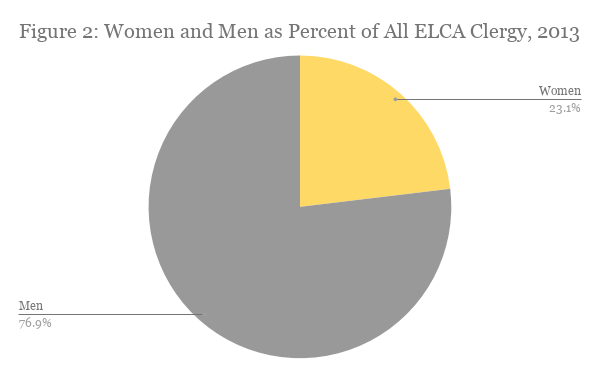
Demographics: displays percentages based on gender and race in 1994 and 2013.
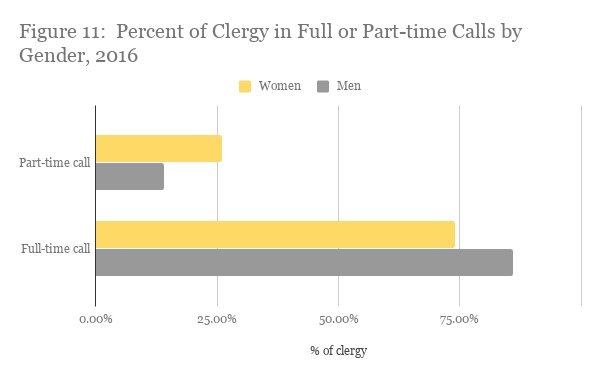
Calls and Compensation: displays source of call based on gender in 1994, type of call by gender in 2016, and compensation by gender and race in 2016.
Marital Status and Sexual Orientation: displays marital status by gender in 1994 and race and gender in 2016, rostered partner by gender in 1994, and sexual orientation by gender and race in 2016.
A fourth group, Cumulative and Comparisons: displays
- the number of women ordained, over time and by synodical distribution
- the percentage of ELCA clergy who are women compared with other mainline American Protestant denominations
- the Lutheran churches worldwide that do or do not ordain women
- the synods that have elected women bishops.
These visualizations are based on data collected and reported by the the Office for Research, Planning, and Evaluation (ELCA), prior to 2005 in partnership with the Commission for Women. Surveys were conducted for the twentieth, twenty-fifth, thirty-fifth, and forty-fifth anniversaries of women’s ordination. ELCA staff also responded to requests for specific additional data. Some of the ELCA reports are available from its Archives as PDFs. (See Bibliographies on this site.) Other information comes from the Lutheran World Federation and by permission from Eileen Campbell-Reed.
Explore the Maps & Figures