Statistics
 Minnesota is home to over 300,000 Asian Americans; however, their income, education attainment, and English proficiency all vary. Many believe that Asian Americans overall benefit from such universal success. Although many Asian Americans such as the Chinese, Indian, and Japanese communities have higher socioeconomic and educational status, there are other groups, particularly the Southeast Asians, whose backgrounds differ drastically. It is important to also look beyond aggregated data. Aiming to contextualize, we have visualized various sets of data below, based on the 2000-2010 US census and other surveys, that hope to provide a better understanding of the different ethnic groups and their challenges.
From the more generic information concerning population breakdowns to more specific statistics about adult educational attainment, we hope these graphs help to bring positive discussion among the drastically different Minnesotan Asian experiences. Although some groups are successful in education attainment, this tells only half of the story. It is essential to also address and make visible the many first-generation immigrants and refugees stories from Asia.
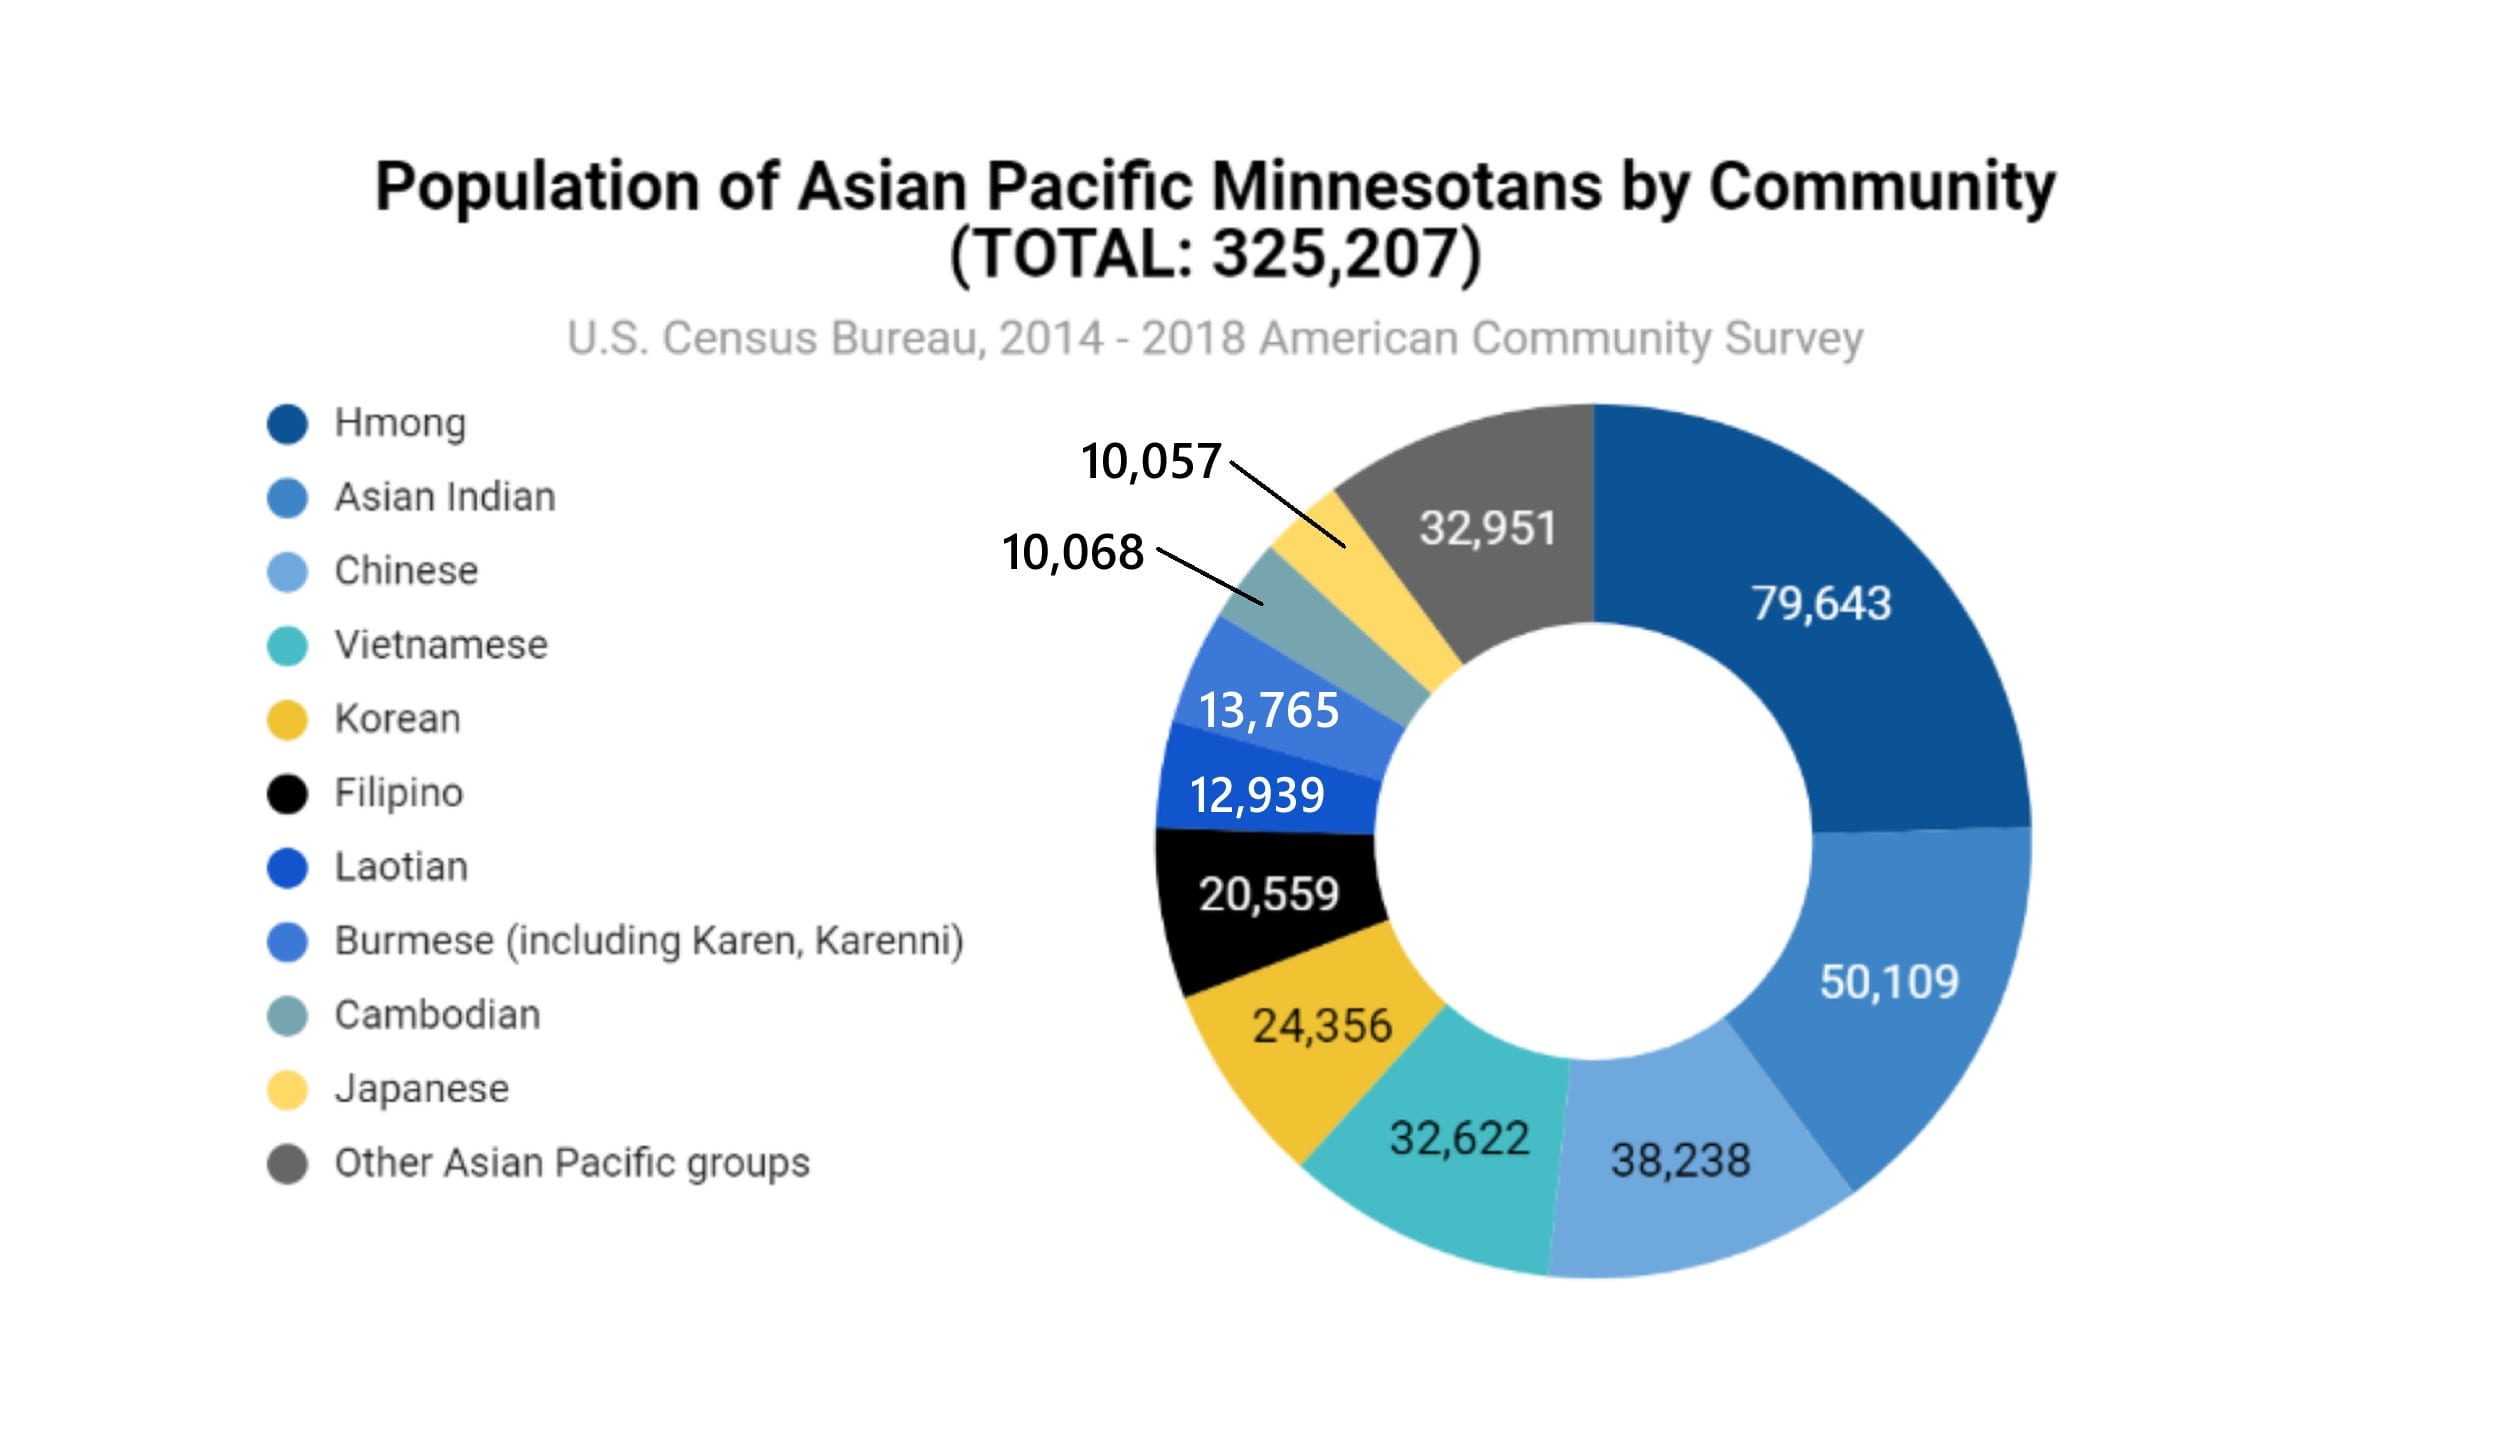
Population of Asian Pacific MN by communities.
The graph shows that the three largest Asian communities in Minnesota are: Hmong, Asian Indian, and Chinese.
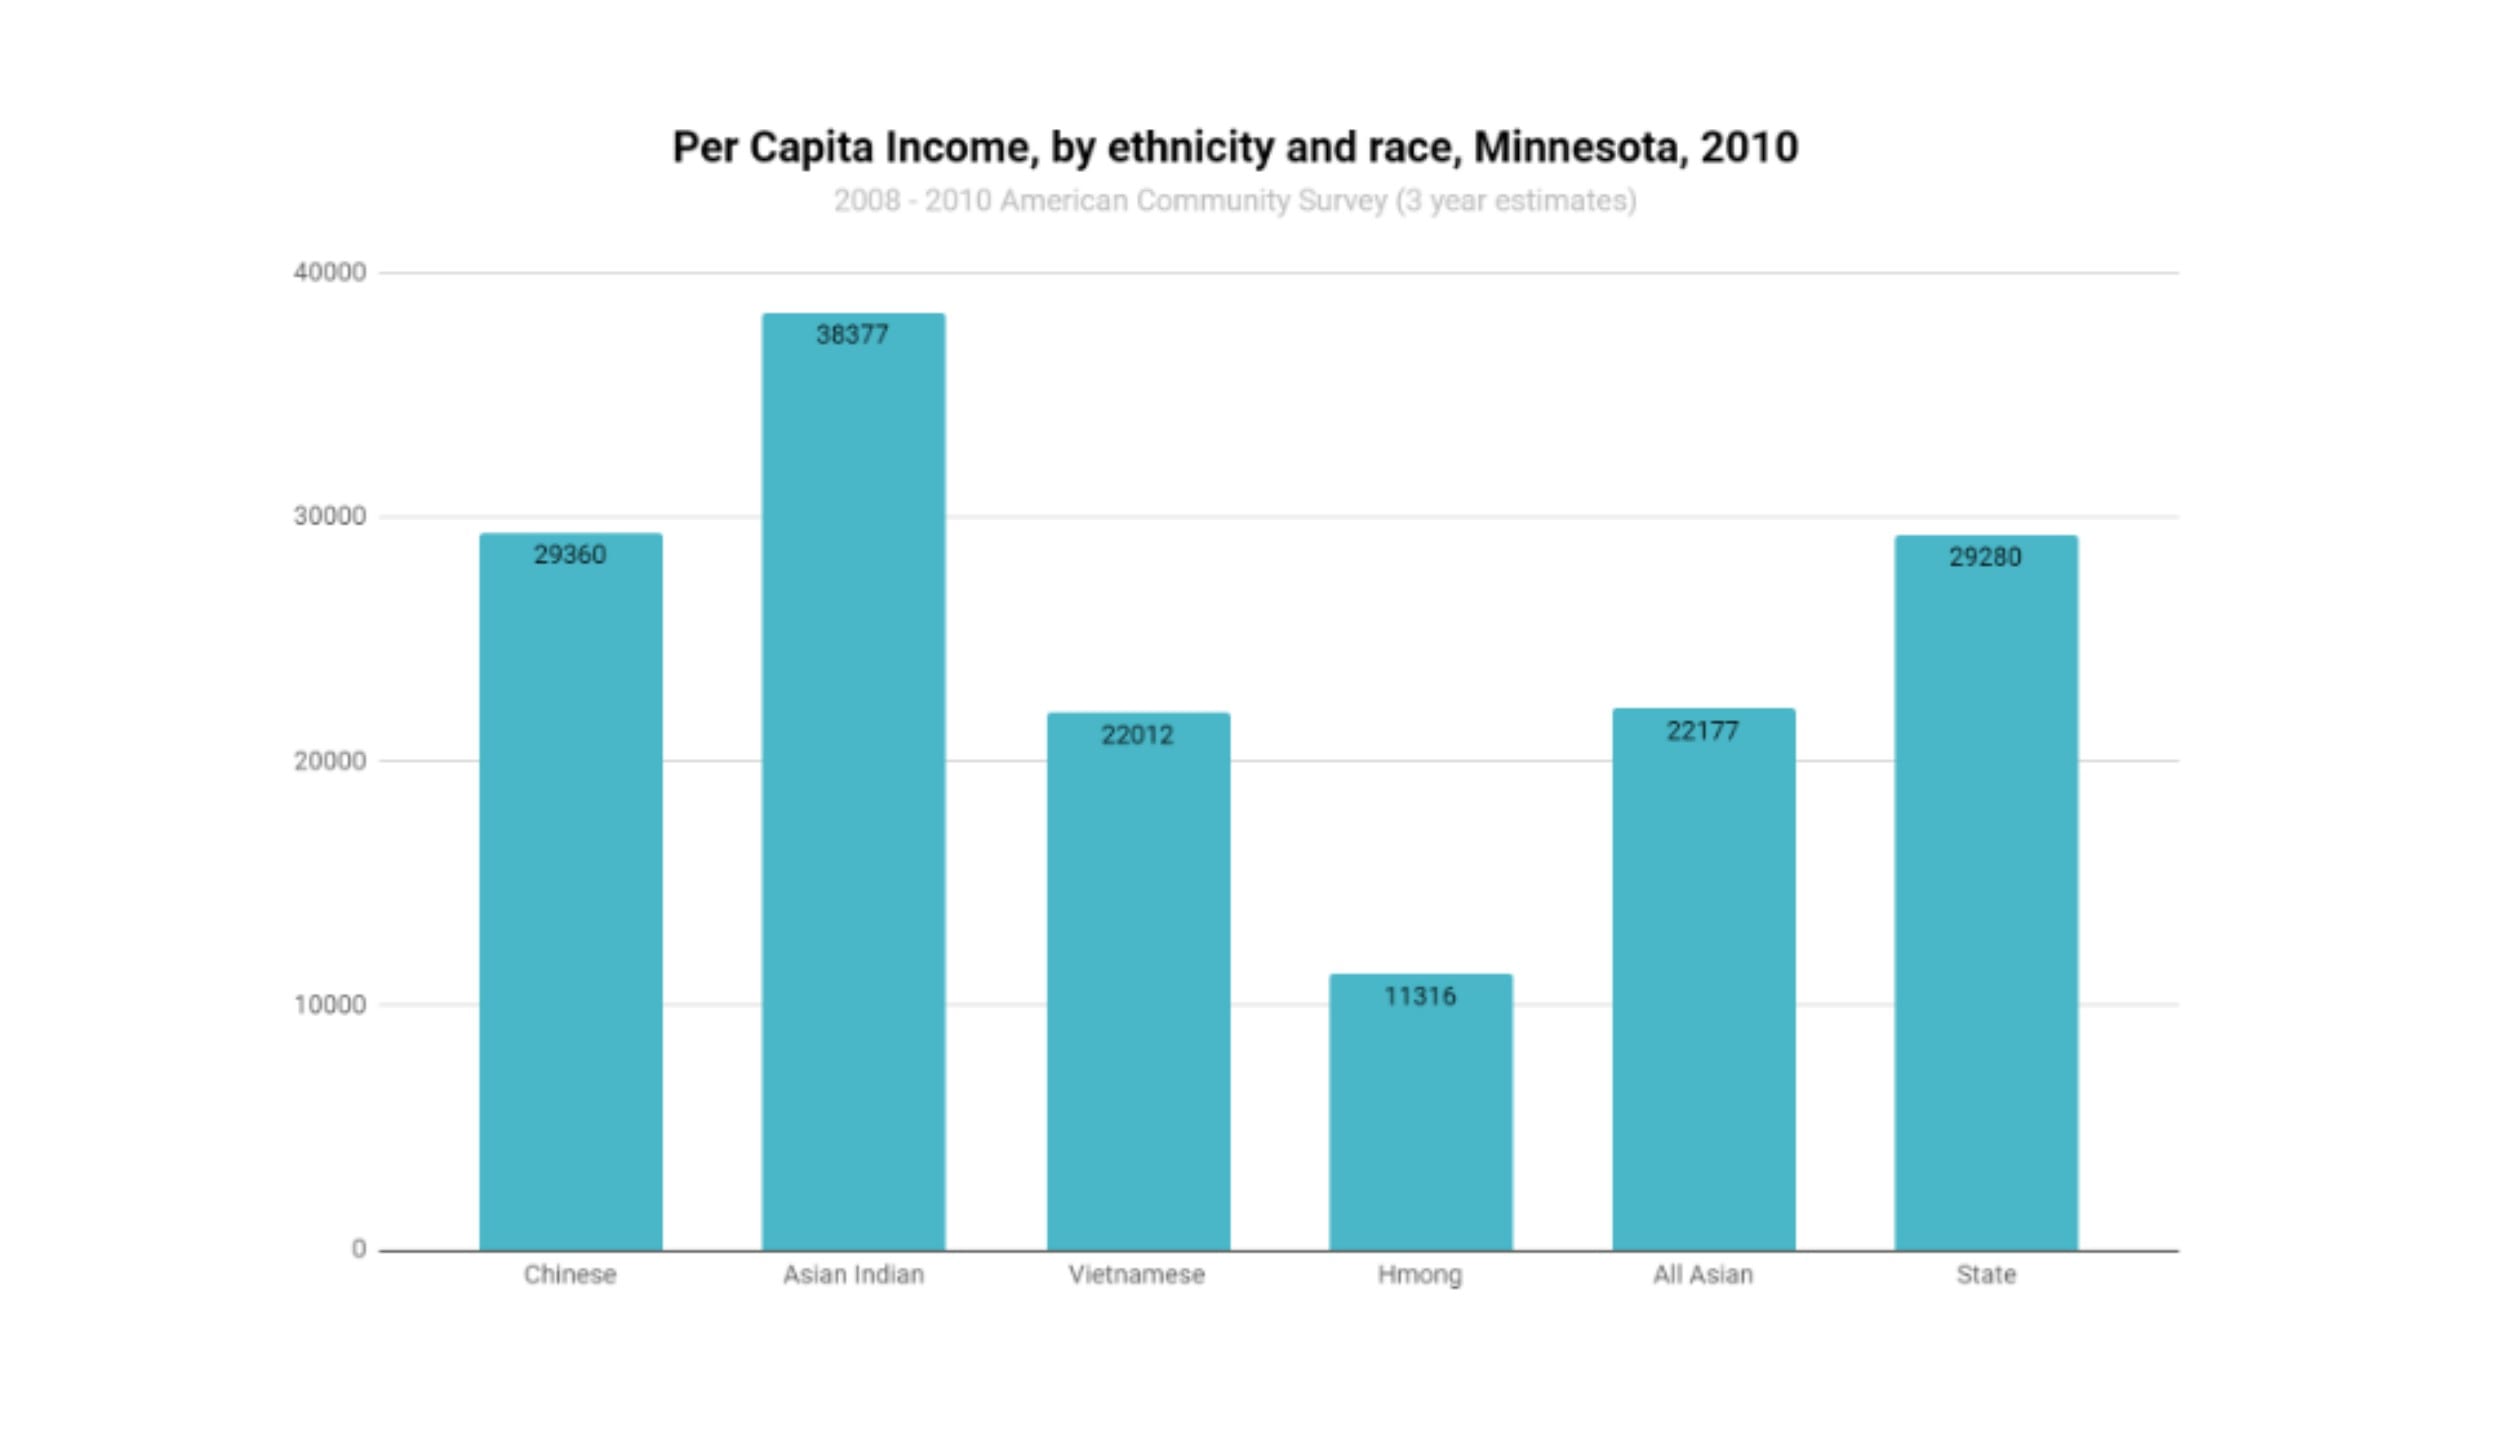
The bar chart shows the per capita income by ethnicity and race in Minnesota. Asian Indians have the highest income and Chinese have the second-highest income per capita. Comparatively, Hmong have the lowest income per capita.
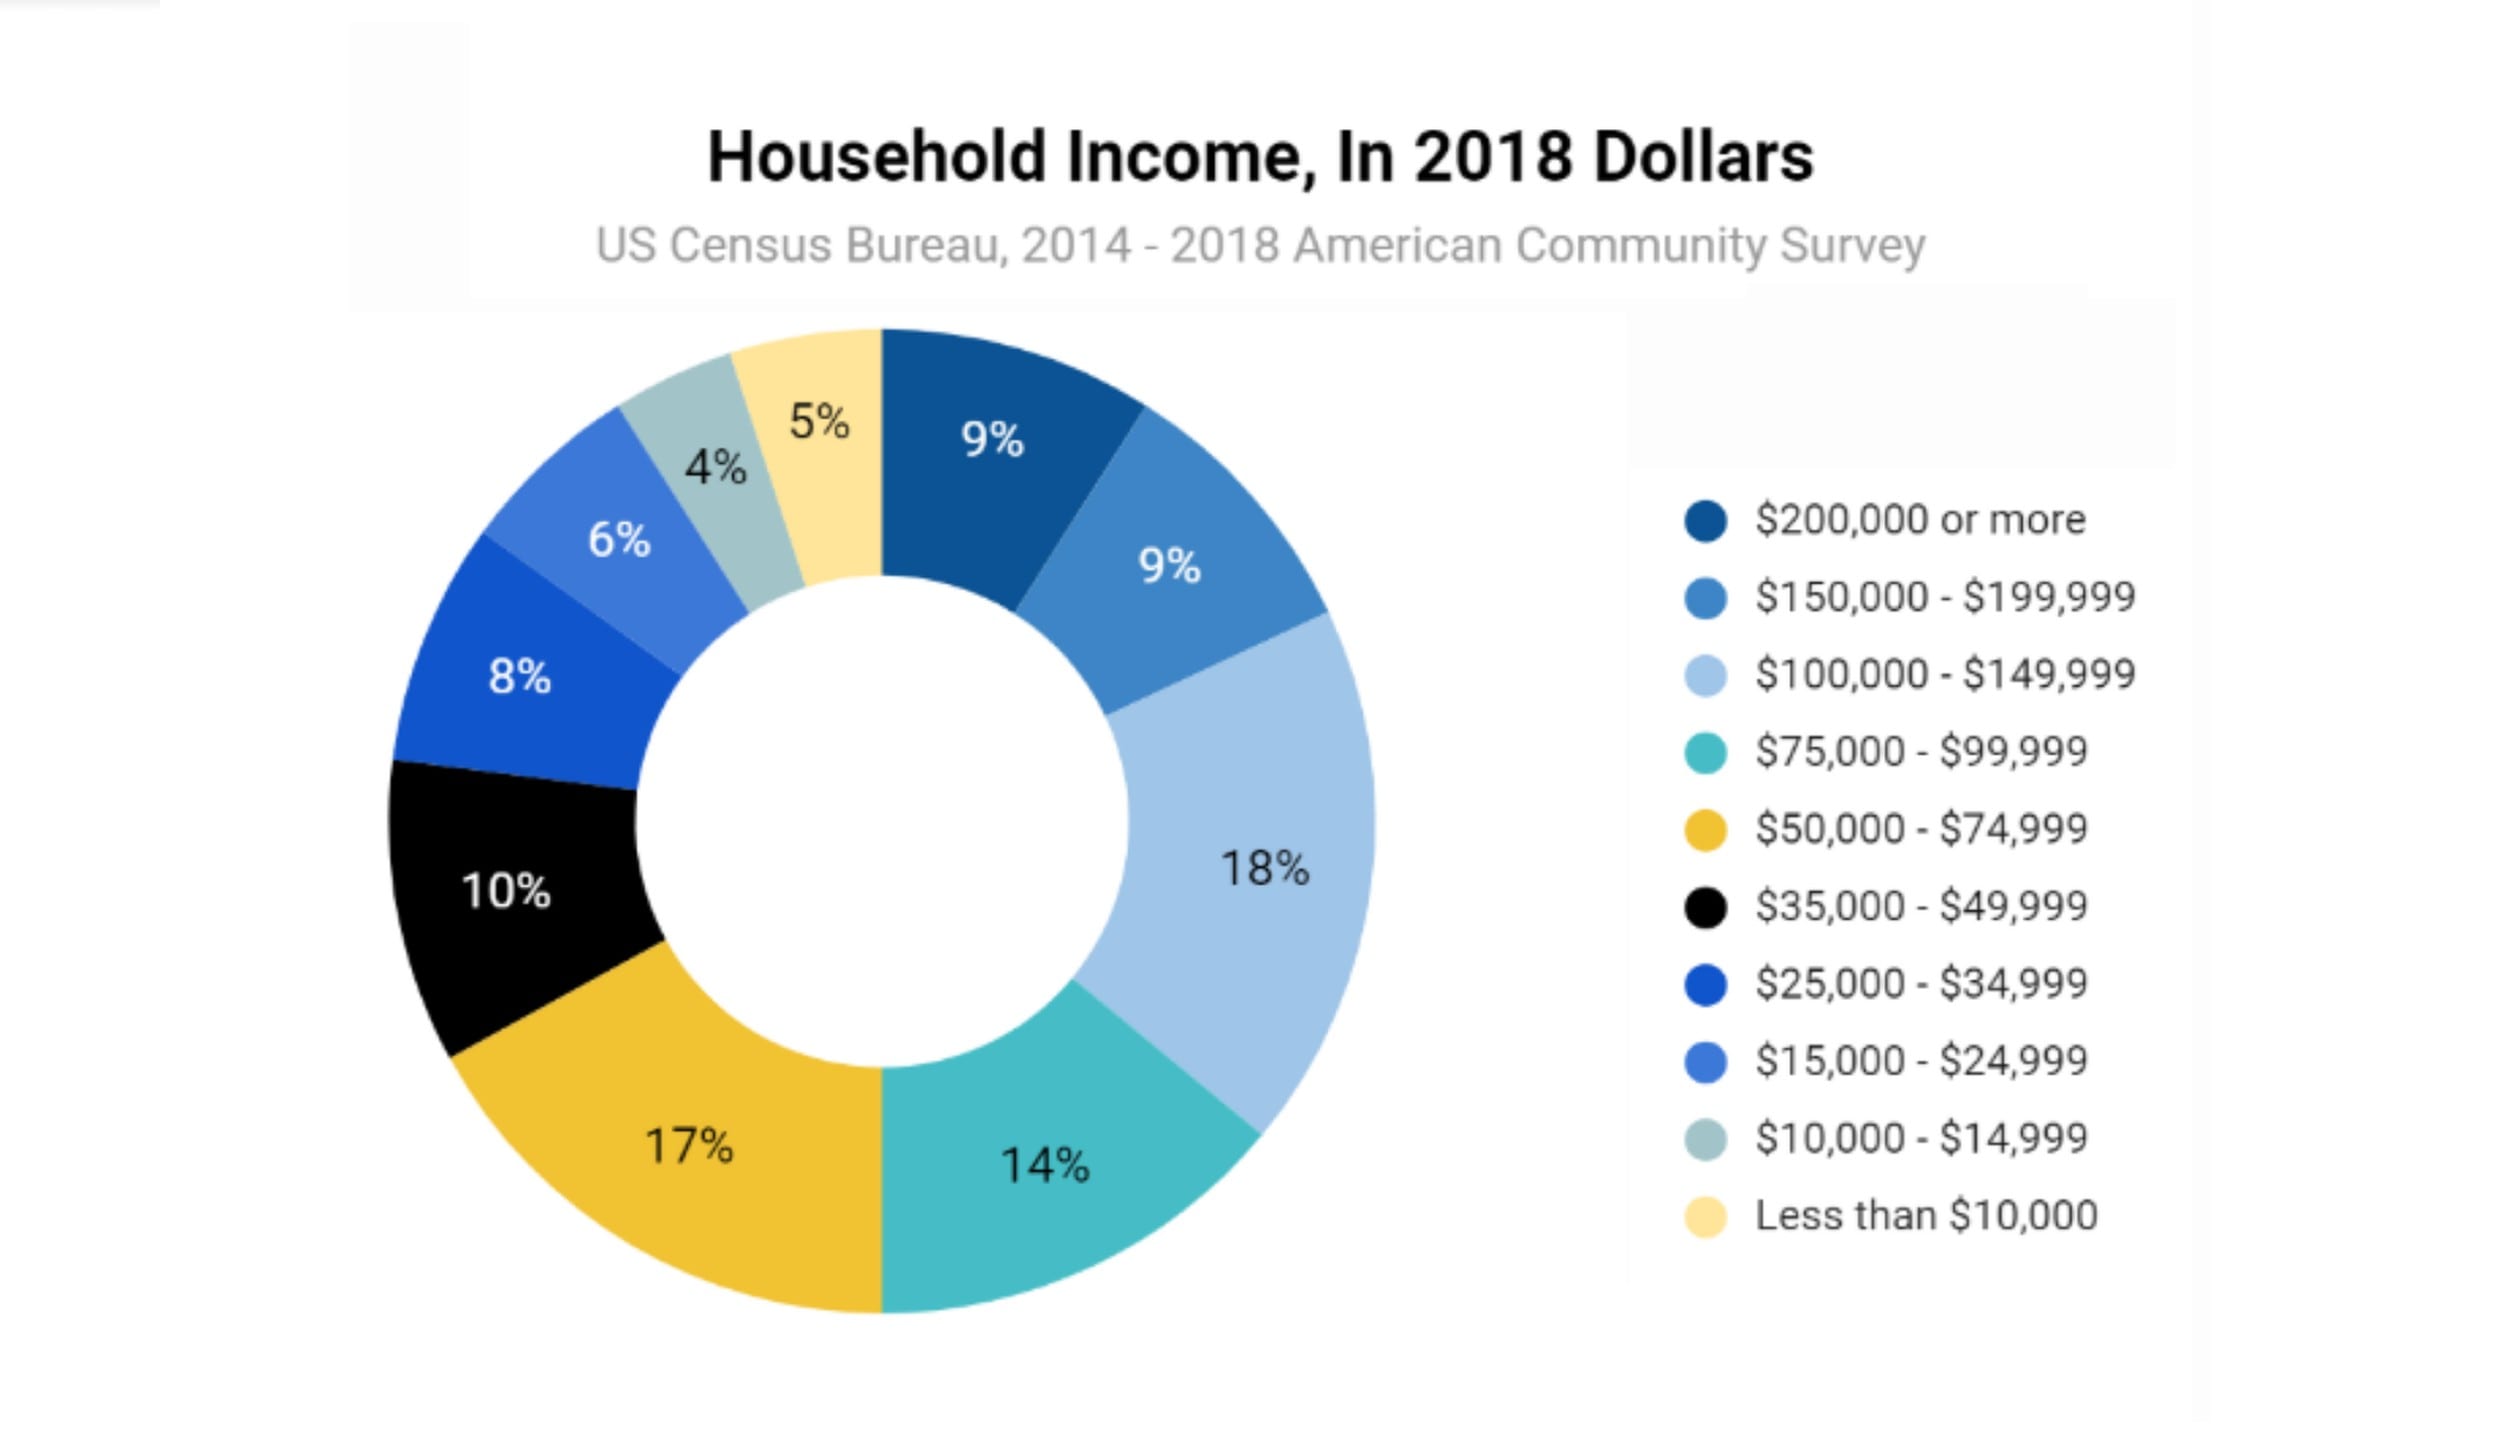
The pie chart on the right shows household income earned in 2018 for the overall American community. When comparing this graph to the previous one, Asian Indian’s per capita income in 2010 fell slightly below the $40,000 mark. Using this pie chart as a guide, this means that they are in the second-largest group for household income. In comparison, Hmong’s per capita income in 2010 falls slightly above the $10,000 household income mark. This means they are part of the 4% of American households to make $10,000-$14,999.

The bar chart on the left shows combined unemployment data in Minnesota from 2008 to 2010. the Hmong population has the highest unemployment number of 12.6%. The other groups such as Asian Indian, Chinese, and Vietnamese unemployment percentages are less than half. The white population has the second-lowest unemployment rate of 6.6%.
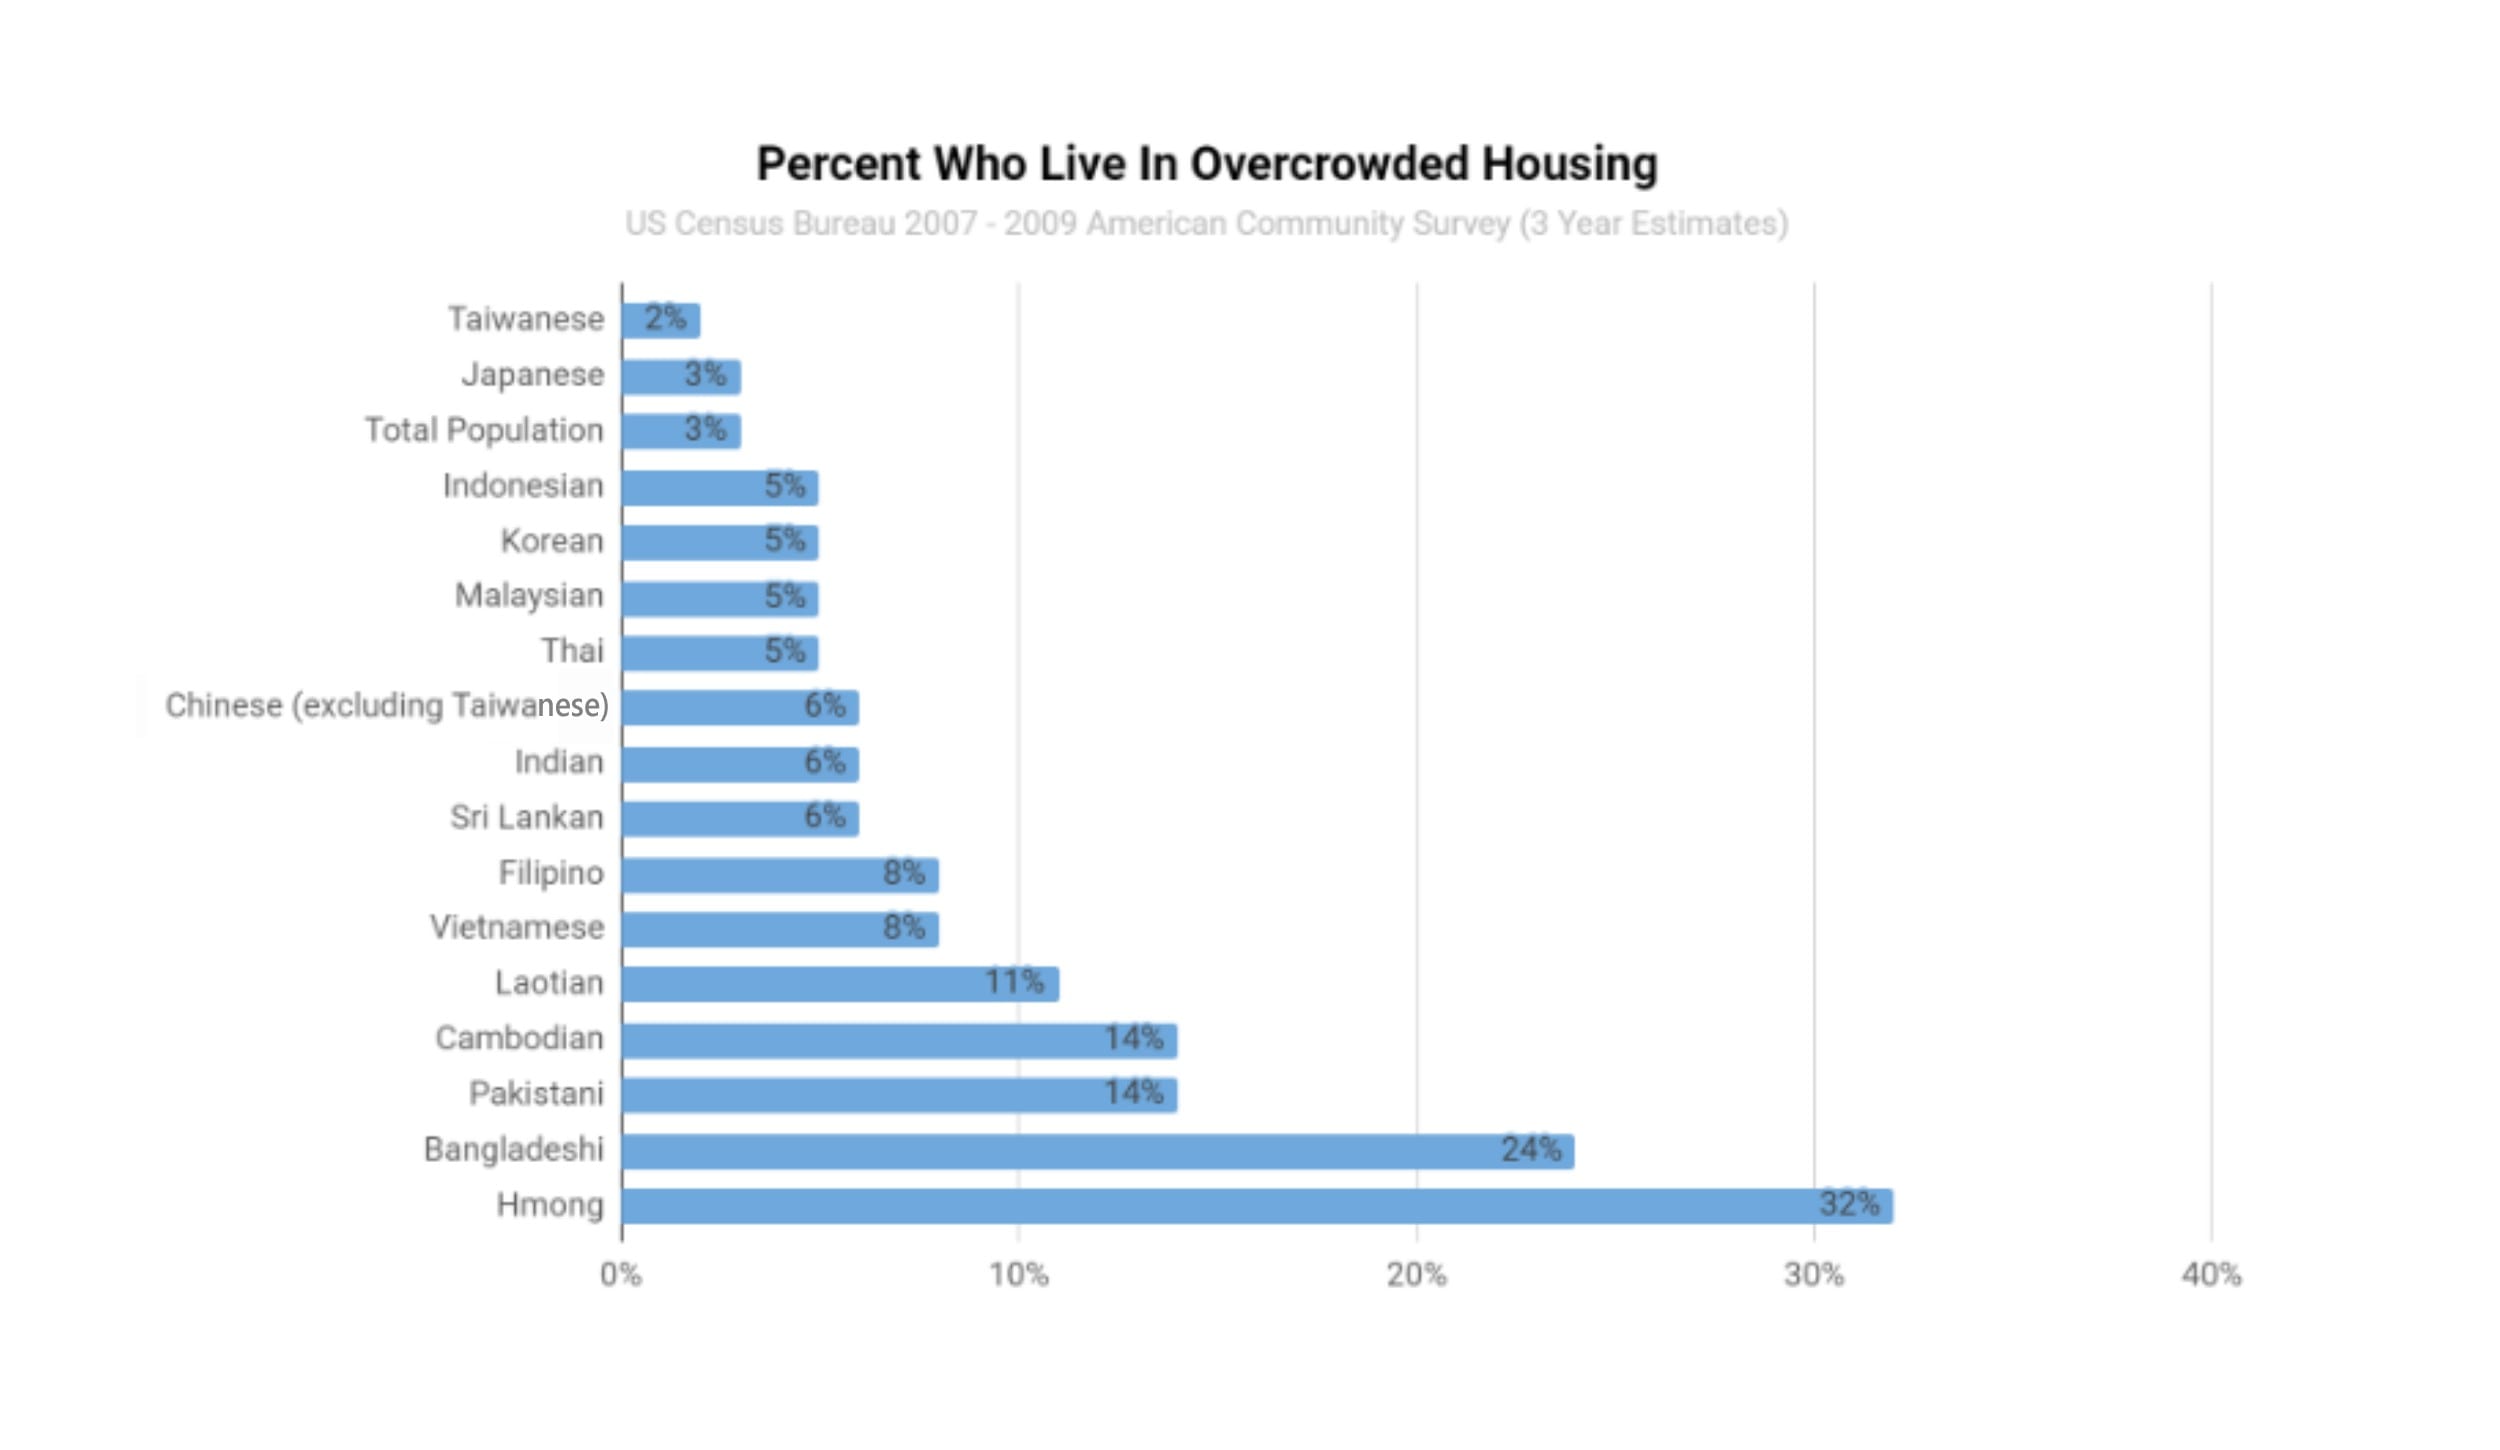
The bar chart shows the percentage of 2007 to 2009 overcrowded housing estimates in Minnesota. The Hmong population has the largest percentage of 32%, followed by Bangladeshi population with 24%. In comparison, 6% of the Asian Indian community and 3% of the Japanese community has overcrowded housing.
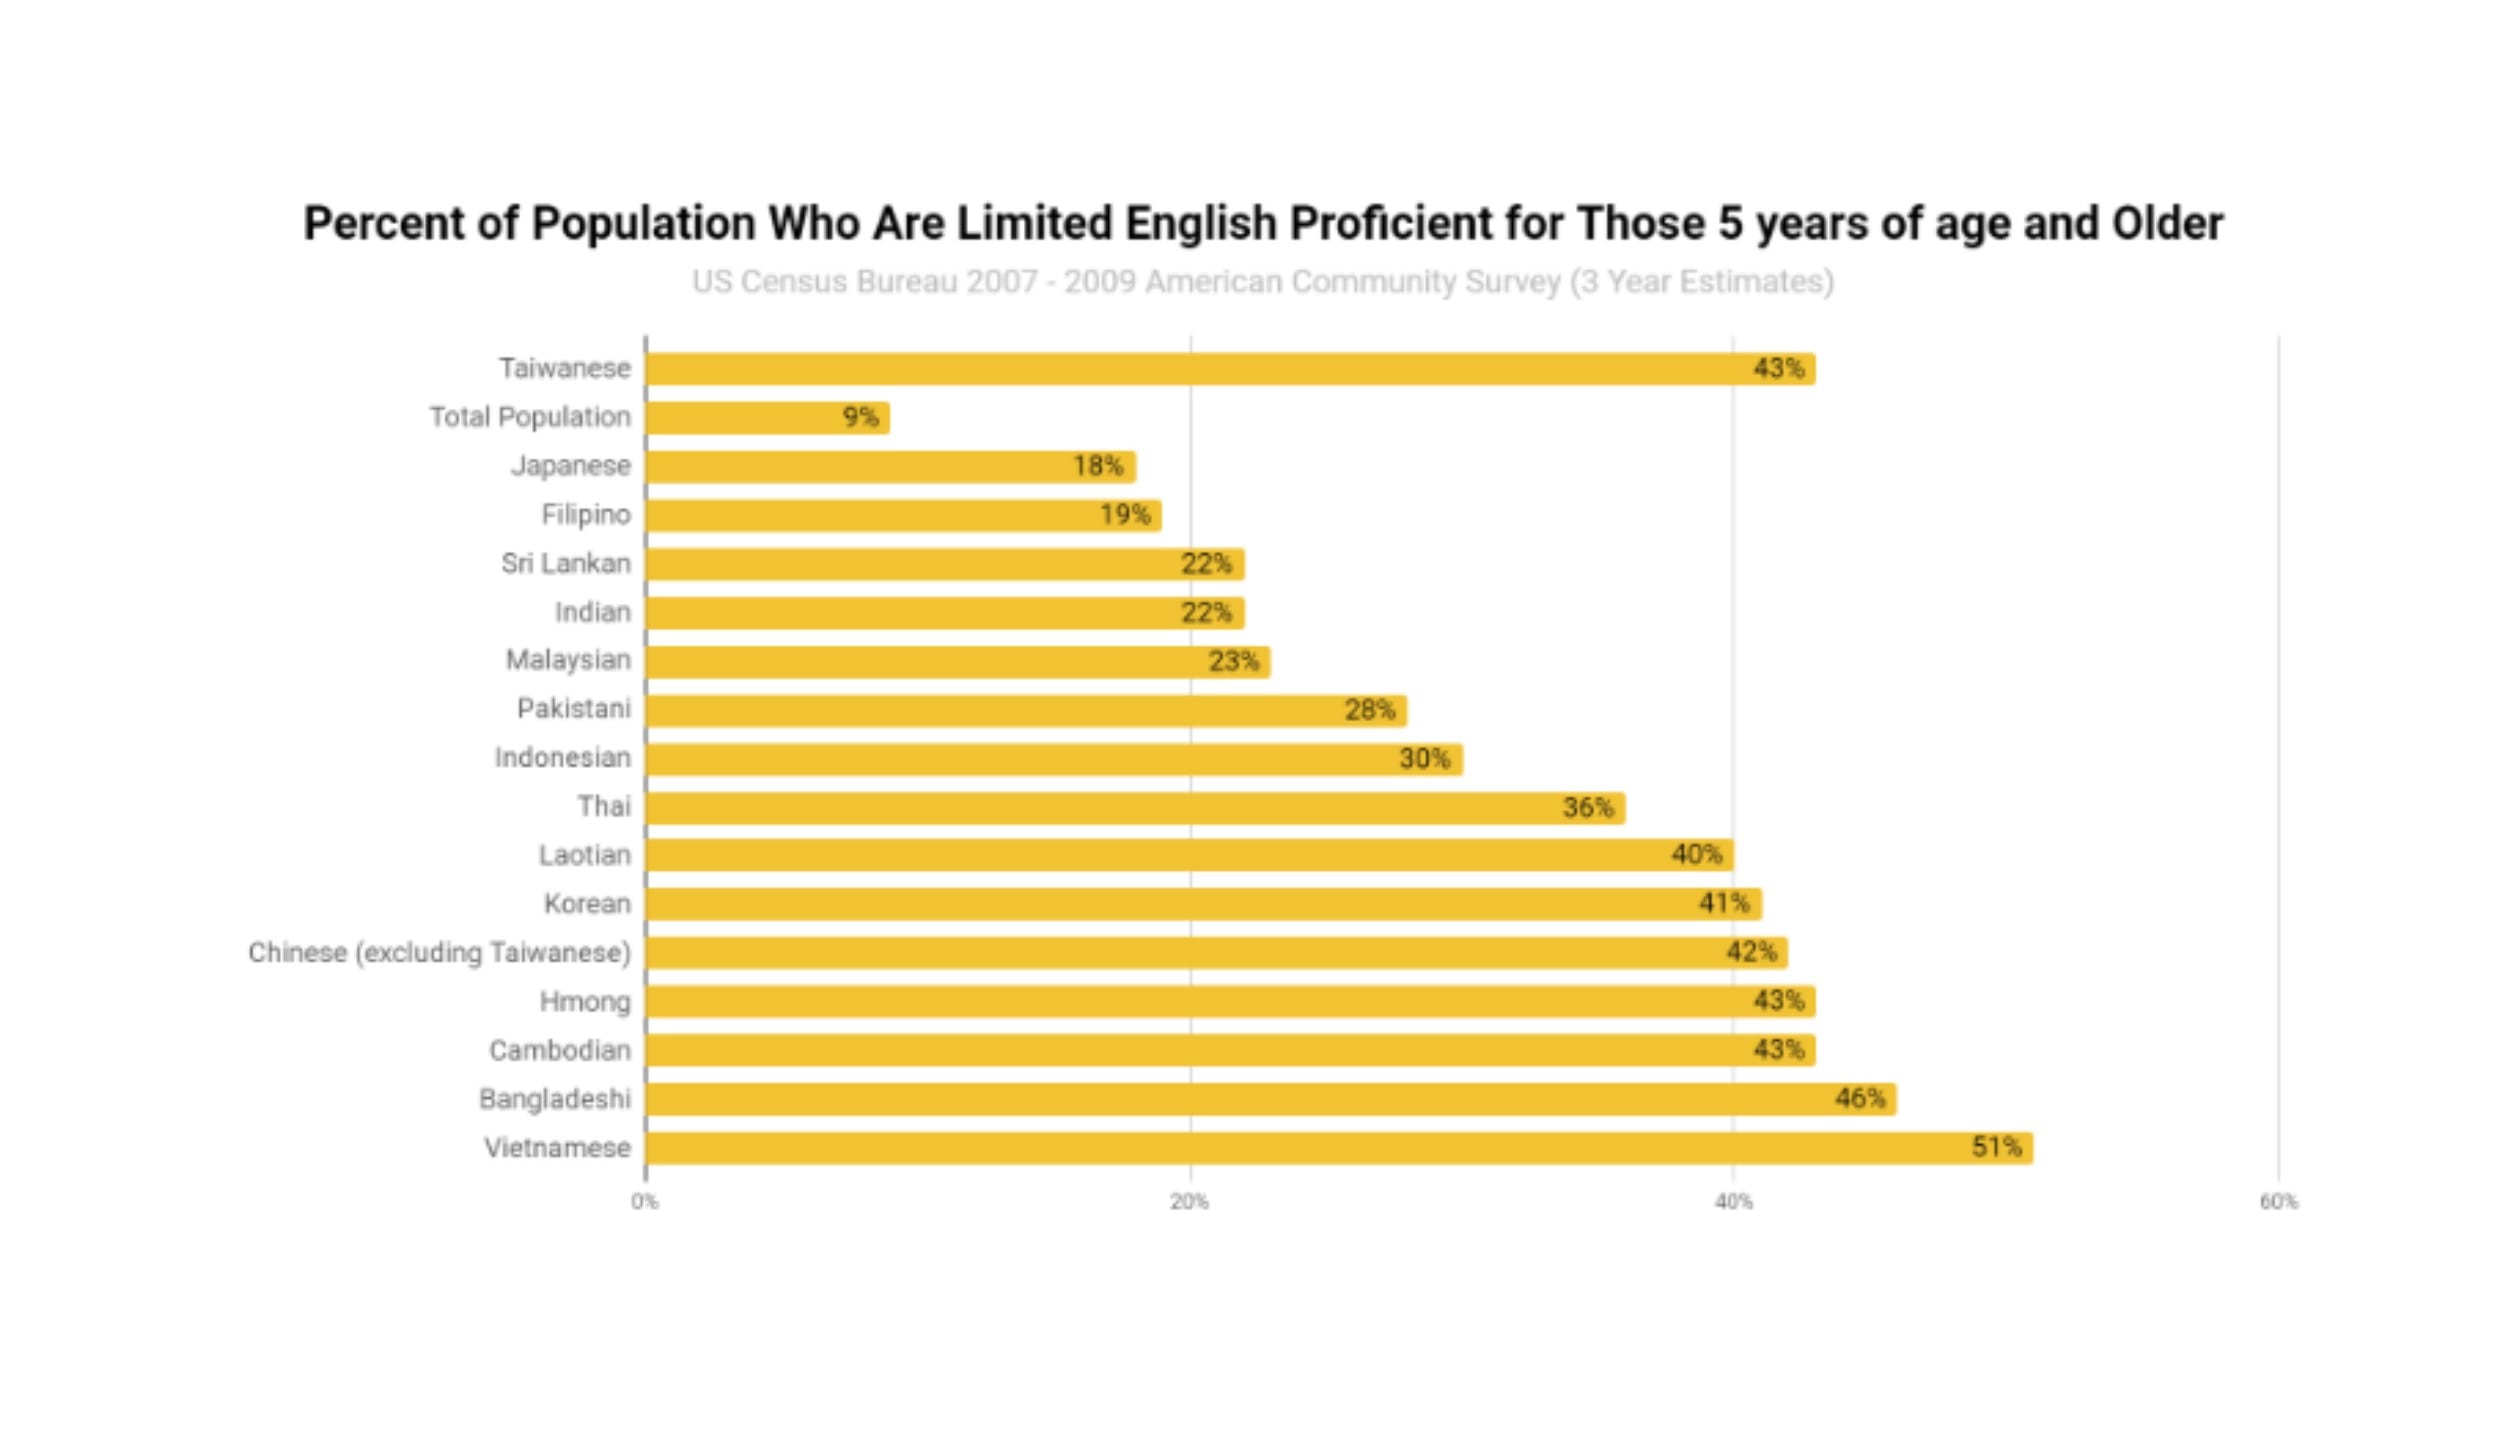
This bar chart on the left shows the percentage of the population who are limited English proficient from 2007 to 2009 estimates. The Vietnamese population has the highest percentage of 51%, followed by the Taiwanese population of 43% as the second highest. 43% of those 5 years and older of Hmong and Cambodian populations are limited English proficient. The data clearly shows overall there are high percentages of every Asian American population who are limited English proficient.
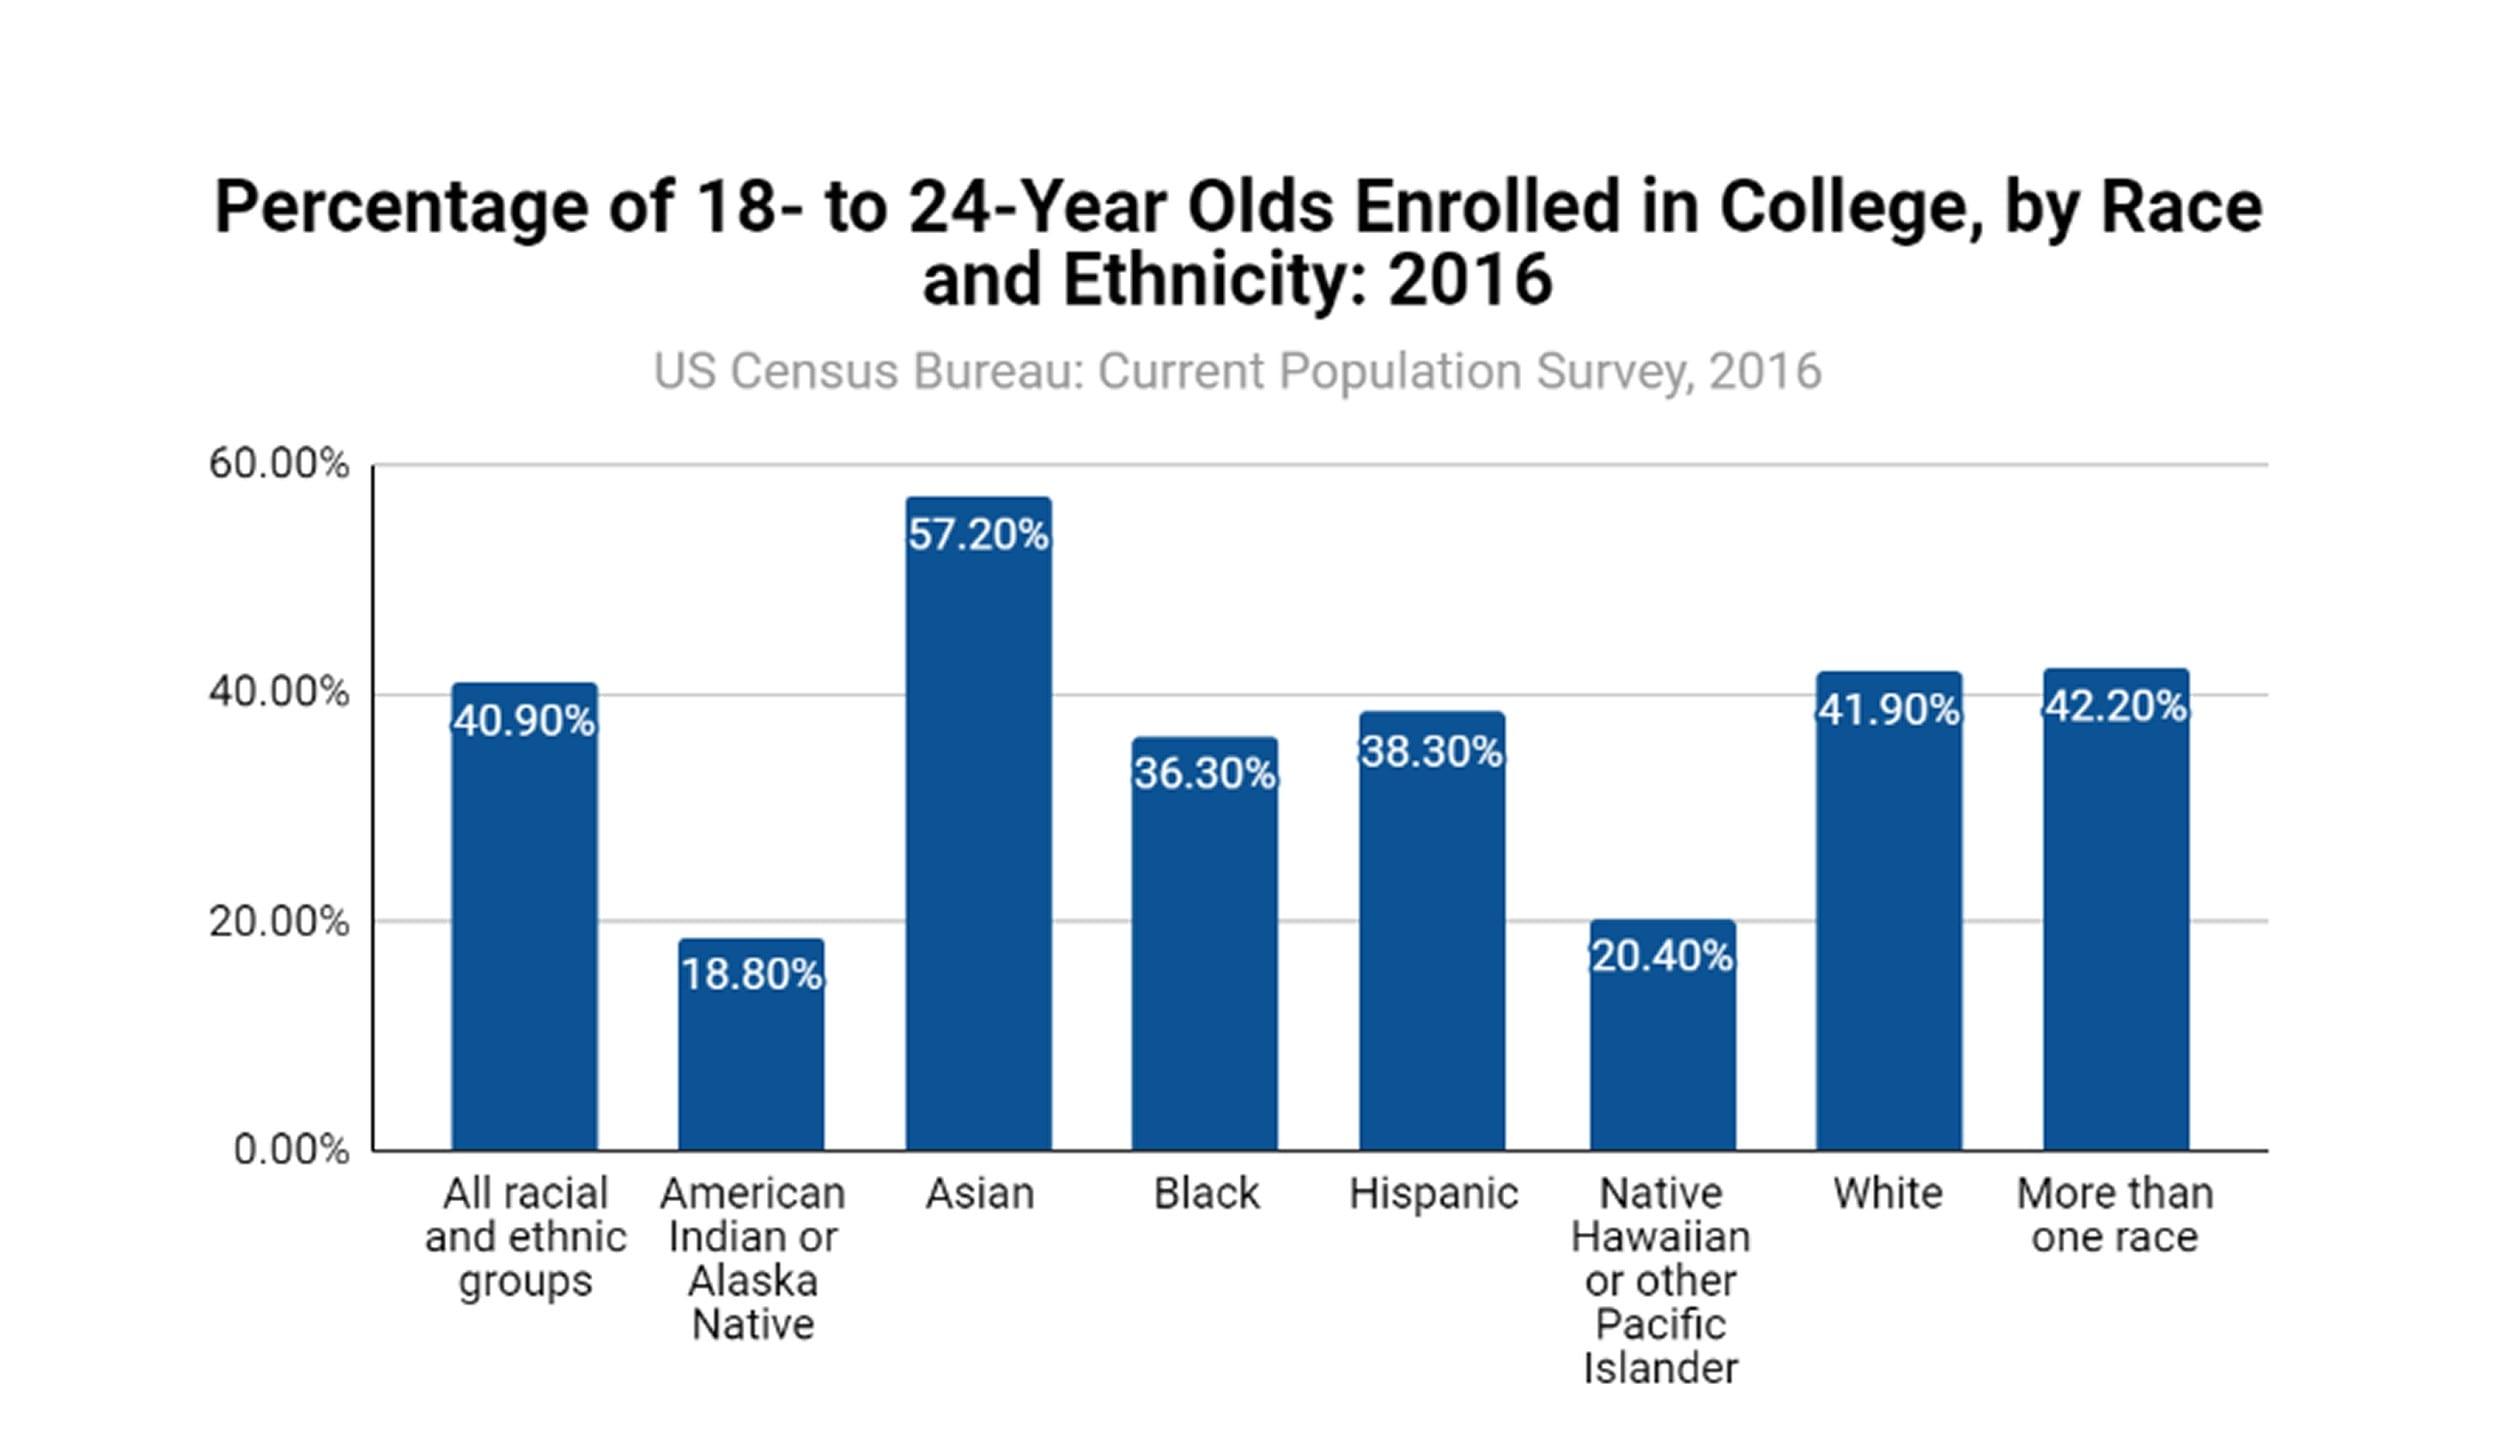
This bar chart shows the percentage of college enrollment by race and ethnicity in 2016. Compared to other ethnic groups such as 36.3% of Black who are college enrolled, the Asian population has the highest college enrollment of 57.2%. However, this aggregated data only tells one side of the story. The category of more than one race has the second-highest college enrollment of 42.2%. All the other ethnic groups are around a high 30% of college enrolled.
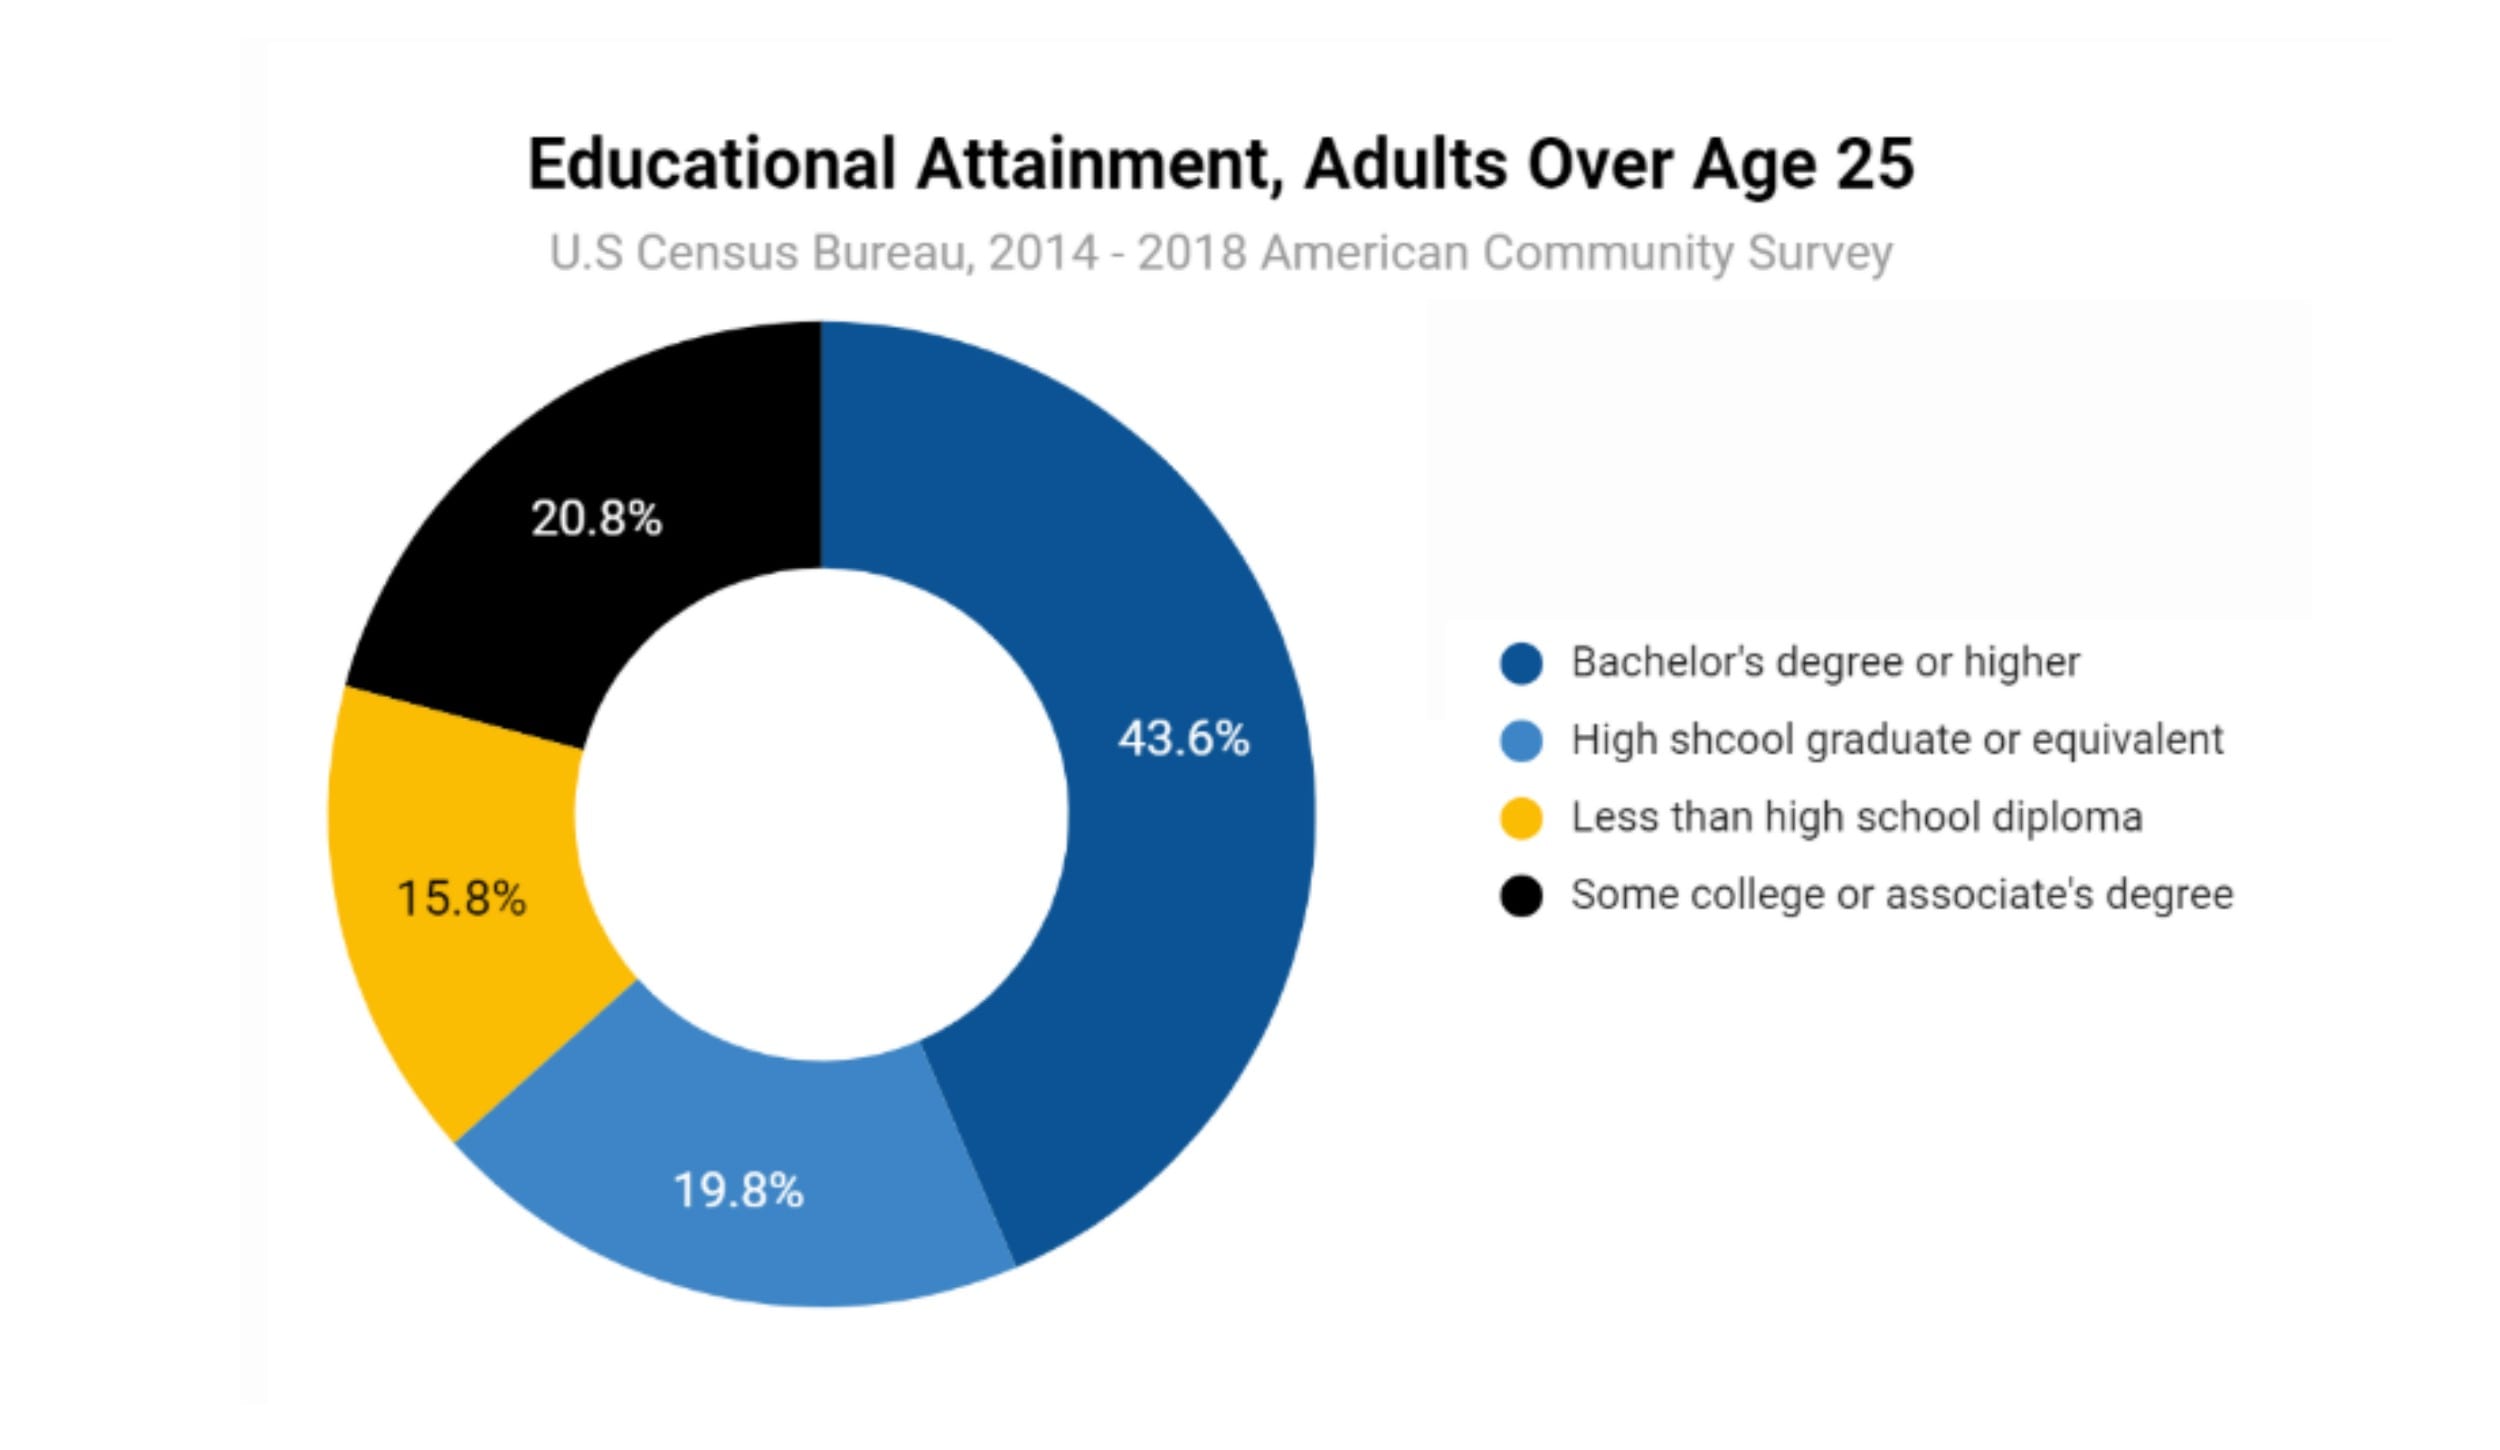
The pie chart shows the educational attainment of adults over age 25 from 2014 to 2018. 43.6% of all adults over 25 have a bachelor’s degree or higher. Those who have some college or associate’s degree is 20.8% of American adults. High school graduate or equivalent makes up 19.8% of American adults. The lowest percentage is 15.8% of American adults who have less than a high school diploma.
Sources:
Espinosa, Lorelle L., Turk, Jonathan M., Taylor, Morgan, and Chessman, Hollie M. 2019. “Race and Ethnicity in Higher Education.”
US Cencus Bureau. 2014-2018. “American Community Survey“
US Census Bureau. 2016. “Current Population Survey”
